
First look at debugging .NET 4.0 dumps in Visual Studio 2010
I know that for a lot of you this is a bit far into the future, but I thought it would be nice to run through a few of my lab scenarios to show off some of the new features in Visual Studio 2010.
I am sure that I will miss a bunch of cool features here as this post is just based on my first experience with this, but I will likely post more about these features as we get closer to RTM. As we are only in Beta, anything and everything may change before RTM and the below is just based on my own impressions so there may be other better ways of doing things.
Why debug dumps with Visual Studio .NET
I love WinDbg and will probably continue using it for many years to come since it is a very simple and clean and powerful debugger. I do realize though that not everyone debugs production issues (hangs/crashes etc.) every day (at least i hope not:)), and that most .net developers are very comfortable in Visual Studio.NET, so it is nice to be able to stay within that tool where you recognize the IDE and structure.
If you have compiled the app “debug” and set debug=true in web.config if you are working with an asp.net app, debugging a dump is very similar to being stopped at a breakpoint. Of course, since it is not a live process you can’t hit go, but you can match up source code, see locals etc. without having to learn a bunch of new commands.
There are a couple of caveats here:
- .NET debugging only works on 4.0 dumps – with 3.5 and earlier you only get native debugging
- Visual Studio as opposed to windbg doesn’t seem to use deferred symbol loading (I may be missing a setting here), but this means that when you start debugging a dump you load up all symbols which might take a while (at least the first time). With WinDbg’s deferred symbol loading, it only loads symbols when it needs them which makes it significantly faster to load up a dump in windbg if you only want to check some quick things.
- Mileage varies depending on if your app is compiled debug, you have source lined up etc. If the app is not compiled debug you will not get things like locals or source synchronization.
How do you gather the memory dumps?
You can get dumps with WinDbg (adplus) as shown in this post or debug diag, or in visual studio.net for that matter (debug/save dump as… when you are debugging)
Typically in a web scenario or in a scenario where you are reproducing a problem in a win forms app or windows service on a customer machine you wouldn’t have visual studio installed there, and then adplus or debug diag are good options for gathering dumps.
Setting up symbols
For Visual Studio to be able to resolve native (non-dotnet) function names/parameters/types etc., it uses symbols, like any other debugger. For all Microsoft components there are public symbols located at http://msdl.microsoft.com/download/symbols. If you have your own native components you would have to compile them with symbols in order to resolve function names.
You can set up the symbol paths for your symbols under Tools/options/debugging/symbols and a typical setup would look like this:
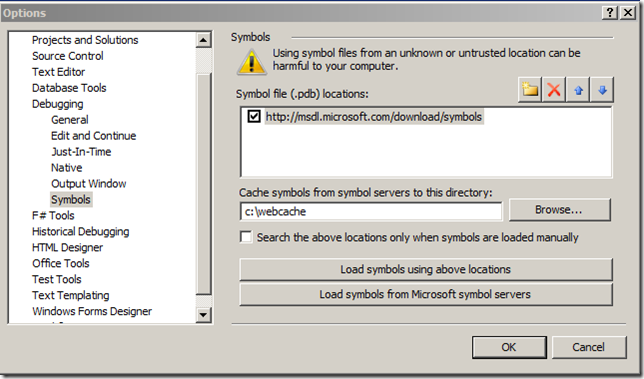
The first time it loads up the symbols it will find them in http://msdl.microsoft.com/download/symbols and as it downloads them it will put them in your cache location c:\webcache. The next time you look at a dump, it will check the c:\webcache location first, and only download the symbols it can’t find there. This means that the first time you look at a dump (any dump) it may take a long time depending on your internet speed as these files can be pretty big, but the next time it should be significantly faster.
In here you can also add the locations of any of your own symbols and this setting is persisted, so the next time you open VS, the symbol paths are there for you.
Notice that there is a button for “Load symbols from Microsoft symbol servers”. This is available once you have started debugging a dump or any process, and this will do the above for you, setting up a local cache if you haven’t done this already. I like setting it up explicitly as pushing the “Load symbols from Microsoft symbol servers” leaves the UI “hanging” without visual feedback so you don’t know how far you have gotten in the process, while setting up a symbol path allows you to see the modules/symbols as they load.
Debugging a simple hang scenario (Debugging labs - Lab 1)
I recompiled Lab 1 with 4.0 (just switching some settings in web.config), ran a stress and grabbed a dump with adplus. Look at the Lab 1 instructions on how to repro and get the dump if you are interested in following along.
-
Open the dump in Visual Studio
File/Open/File – select the dump
This will present you with the dump file summary which contains info about the dump, any exceptions that might have occurred (in this case just a wake debugger (0x80000007) from cdb when getting the dump), along with some info about the OS version and the CLR version.
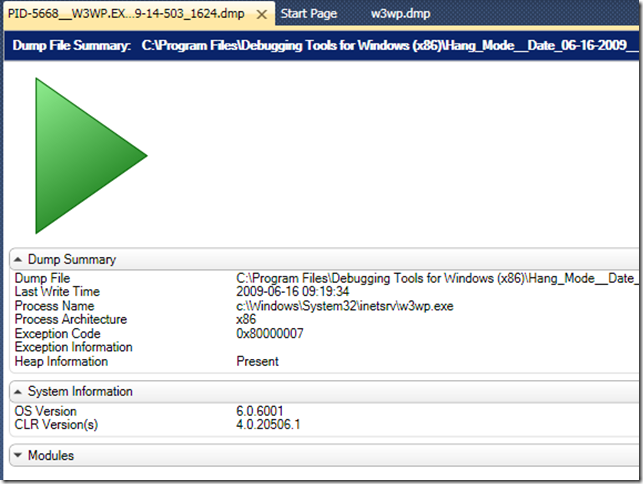
If you move to the right (not shown here) there are also some options to set up symbol paths and debug either mixed or native. The default is mixed.
-
Click on the super obvious green go button :) to start debugging
This will start loading symbols and get you in debugging mode where you can see the stacks for all the threads etc. so grab a coffee, chat with your colleagues about the weekend or watch the symbols as they load :)
At the end it may pop up a message box talking about an unknown exception (this is the wake debugger exception so don’t be alarmed, just click ok or break)
Once you are done loading all the symbols you are presented with the current call stack.
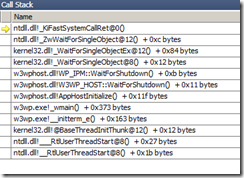
If this would have been a dump taken at a crash or exception this stack is what you would have started investigating. In the case of a hang dump this is rather meaningless since the active thread is thread 0 – just the main thread, which often has little or nothing to do with what you are debugging.
For hangs, we want to see all the stacks, and in particular those running .net code or those that appear blocked for any reason.
-
Open the “Parallel Stacks” window (Debug/Windows/Parallel Stacks)
This is a feature I really like in Visual Studio (and you can use it when you debug normally as well). What it does is it pulls out all the stacks and looks for commonalities. If you have 5 threads doing the exact same thing it will group them together so you get a very nice overview of what is going on.
In this case (image below) for example it shows us that we have 16 threads sitting in
DataLayer.GetFeaturedProducts. 15 of these are waiting in aMonitor.Enter(note that it shows both .net and native stacks here), and one is sitting in aThread.Sleep.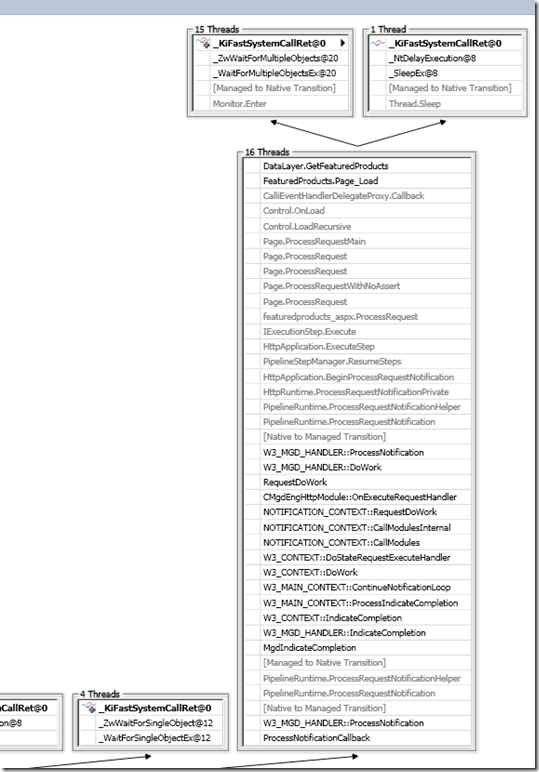
From this, and knowing the code we can deduce that all these requests for FeaturedProducts are waiting in a lock (Monitor.Enter) and the lock is probably owned by the thread sitting in the Thread.Sleep.
Note: So far we haven’t done anything that requires debugging to be turned on, so even if debug=false, you can still get this type of information, and in most cases this might be all you need.
-
Look at source code and locals.
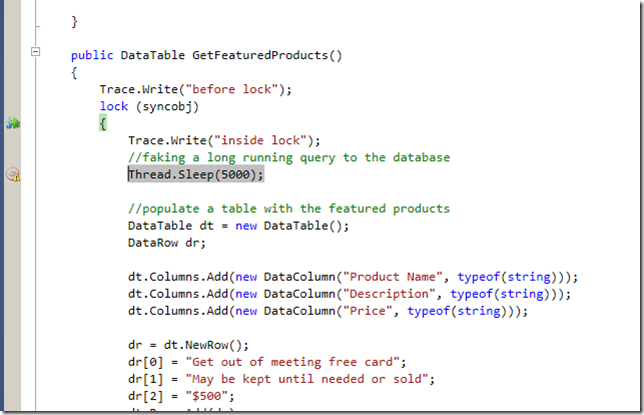
If you want to go into more detail about what is going on, you can right click on the
GetFeaturedProductsframe for example and choose “Switch to frame”, which brings up the source code (if the source is lined up) and shows us with a green arrow what statement we are on (the lock).If you click on the “Show threads in source” button on the debugging toolbar…

…it also highlights in gray the location that the other thread is on and you can also switch to that thread if you want to by right clicking the warning sign in the left sidebar and choosing “switch to frame”
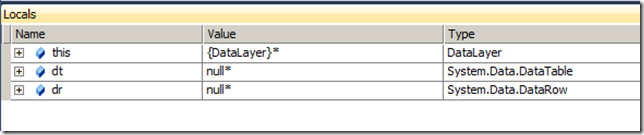
In this case we don’t have a whole lot of locals set, but if you did you could get to them in the same way you would if debugging normally.
In summary
I am really interested to see where this will be going in the future and what additional features if any we’ll see in RTM.
Based on my first experience with this here are my impressions:
Why I would use Visual Studio to debug dumps
- You don’t have to learn a new environment (windbg) or a lot of new commands (sos) for simple scenarios
- Really nice visualization of the threads, it makes it very easy to spot the important ones
- Matching up source code is very useful as with windbg you have to jump through hoops and match IL with source to figure out where you’re at
- Looking at locals the Visual Studio way is a lot easier than using !do in sos to navigate through it. As Visual Studio can make use of debug info it can also name the locals which is not possible in windbg.
- The native and managed stacks are intermingled as Visual Studio is a true mixed mode debugger while windbg for example is really native only (using sos as a helper to look at .net stacks)
Why I would stick with windbg
- If you don’t have debug info, you can’t get locals or items on the stacks. You can get this with windbg/sos, even if you don’t have variable names it is still very useful information.
- Since Windbg uses deferred symbol loading it is a bit faster to load up a dump in windbg.
- You can debug .net 2.0/3.5/1.1/1.0 dumps etc. in windbg and 4.0 dumps
- In Visual Studio (beta 1) I have not found a way to look at the managed heaps so debugging memory issues is still a task for windbg, or by loading sos in visual studio.
- SOS contains a lot of nice commands that allow you to look at .net data in various ways (looking at exceptions, gc heap info etc.), again you can load sos in visual studio to get this info, but windbg feels more natural for this.
In reality I will probably use a combination of both + debug diag depending on scenario, but I hope this post has given you some insight into the topic and what’s to come.
Have fun, Tess